Why is My Classifier Discrimanatory?
A fresh view on understanding and addressing unfairness in classification (and regression) models.
Reading Summary
chen2018why (Chen, Johansson, and Sontag 2018)
Title: Why is My Classifier Discriminatory? {ArXiV preprint, 2018} (9 pages).
Authors: Irene E. Chen, Fredrik D. Johansson and David Sontag. (Massachusetts Institute of Technology)
Key words: Fairness, Data Ethics, Data Science.
Fairness is often viewed as a secondary objective in machine learning, which must be bought at some cost to a model’s predictive performance. Chen, Johansson, and Sontag (2018) argue that when machine learning is applied in areas such as medicine, finance or criminal justice, any misclassification will have serious and lasting consequences for the individuals involved and therefore any such compromises are not acceptable.
The authors argue that we should instead try to understand the source of the unfairness within a classifier and how this might be addressed by targeted collection of additional data. The authors decompose common loss functions into three components (which they call bias, variance and noise) and use these to advise on the collection of additional data.
Notes
Identifying unfairness through loss-decomposition
If we use predictors \(X\) to model an outcome \(y\), resulting in predictions \(\hat y\), then the loss function may be considered as the sum of three terms:
- Bias is the loss contribution caused by using a particular model and a finite dataset to approximate the joint distribution \(\pi(X,y)\) as \(\hat\pi(X,y)\).
- Variance is the expected loss contribution caused by sampling variability in model predictions under a particular model (\(L(X,y)\) vs \(L(X^\prime,y^\prime)\)).
- Noise is then remaining loss that is independent of the model used, caused by variability in the response that cannot be attributed to any of the measured predictors.
Such a loss-decomposition for each level of a protected attribute, across which we want to ensure fairness.
- Differences in bias indicate that the model is insufficiently flexible to approximate \(\pi(X,y|A=a_i)\) for all levels of the protected attribute. Differences in bias between protected subgroups could be addressed by considering a more flexible model, or separate models for each subgroup.
- Differences in variance might be caused by differences in sample size (e.g. \(n_{a_i} >> n_{a_j}\)) or differences in predictor variability between groups (e.g. \(\text{Var}(X|A=a_i) >> \text{Var}(X|A=a_j)\)). Differences in variance might be addressed by targeted collection of further observations from under-represented or highly variable subgroups (i.e., adding rows to the data).
- Differences in the noise term suggest that, for some level(s) of the protected attribute, there is additional variability in \(y\) that cannot be described by the measured set of predictors. Differences in the noise contribution are unrelated to the model choice or dataset size and “may only be reduced by measuring additional variables” (i.e., adding columns to the data).
The cliche of more data
Improving model performance by collecting more data is far from an original suggestion. Chen, Johansson, and Sontag (2018) provide novelty by suggesting what data and how much of it to collect, in order to improve the fairness of the resulting classifier.
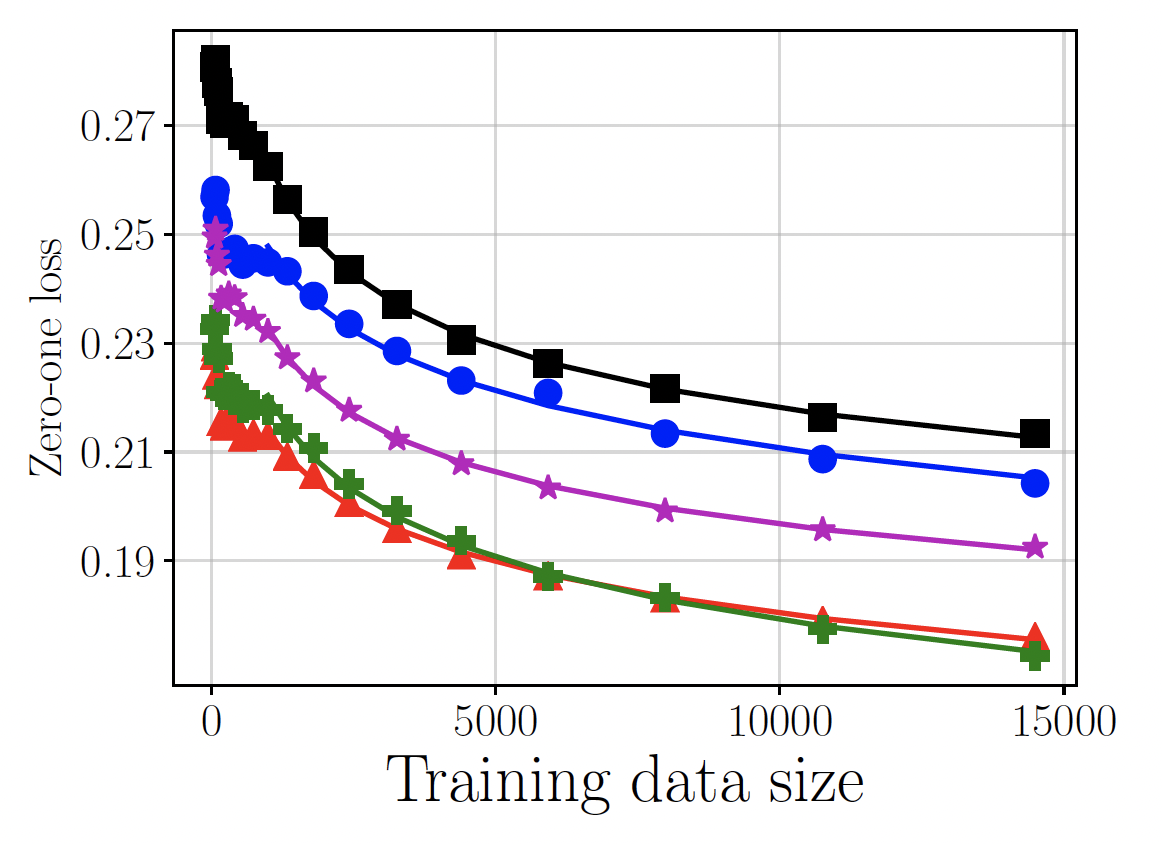
When there are large difference in the variance term between subgroups, we must decide how many additional observations to make in each protected subgroup. Chen, Johansson, and Sontag (2018) model the expected prediction loss within each subgroup (\(a \in A\)) as a function of sample size using a shifted inverse power-law distribution:
\[ \bar L_{\text{pred}}(n_a) = \alpha_a n_a^{-\beta_a} + \delta_a,\]
where \((\alpha_a, \beta_a, \delta_a)\) are subgroup-specific parameters that are to be estimated. The fitted power-law functions are extrapolated in \(n_a\) to identify the subgroups in which further data collection would be most impactful.
When there are large differences in the error term between subgroups, we aim to collect additional predictors to describe variation in the response that is unexplained by the current predictors. Chen, Johansson, and Sontag (2018) suggest a method of identifying additional predictors. The data are clustered based on the current predictor set and discrimination is quantified within each cluster. Expert opinion can then be elicited to suggest additional predictors could further distinguish between outcomes for members of these clusters.
The authors go on to demonstrate these methods on three example datasets: predicting income using demographic information, predicting mortality using the text in clinical notes, and predicting book ratings using review text.